Understanding Your Explainer Video Statistics
Table of Contents
If you have a question about interpreting explainer video statistics that isn’t answered in this article, you can use our contact form to ask your question or click the image below to schedule a call with a member of our production team:
Explainer Video Statistics Video Transcript
This is The Video Igniter Show where we teach you how you can use videos to improve your business. In this episode, you will learn how to look your explainer video statistics to see if people are engaged or if they click away too soon.
Why Your Explainer Video Statistics Matter
In this episode of The Video Igniter Show I’m going to teach you how to view your animated explainer video statistics. Knowing how to interpret & analyze that data will enable you to then improve the effectiveness and conversion rate of your videos.
Free Stats And Analytics For Your Animated Explainer Video
There are many different services out there you can use to host your videos that provide stats and analytics. This enables you to see how people are consuming your online videos. We’ve been using Wistia for over a decade. You can j using them for hosting and analytics because they have a free hosting plan available.

Services like Google Analytics and Wistia let you see your animated video analytics for free.
Understanding The Introduction Of Your Video
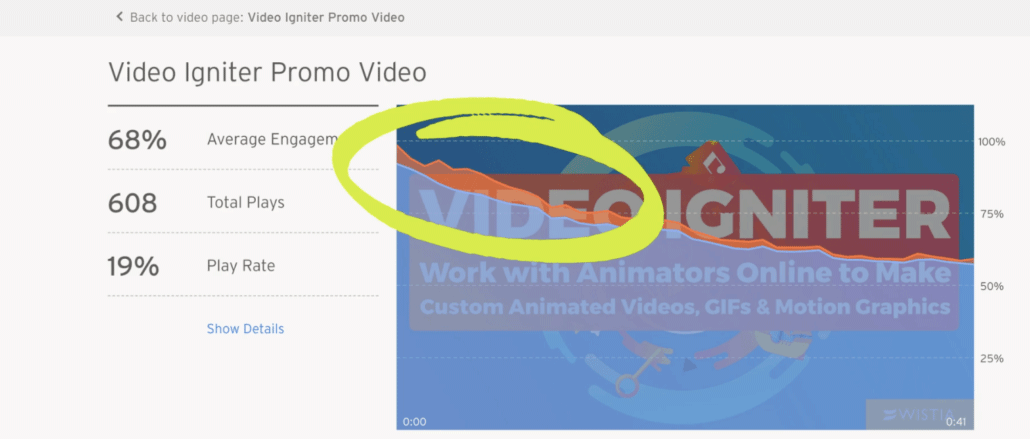
Here’s a video we already published that’s been online for a while now. It’s been seen by hundreds of people already which so there is enough data to show an average viewing pattern for the video. The first thing I look at is the play rate. That’s the percentage of people who arrive on my landing page and actually click play on the video. If your number is low, consider creating a different thumbnail that will encourage more people to click play on the video.
For B2B videos, it makes sense to use the thumbnail to explain what value and benefit the viewer will get if they take the time to watch your video.

In the first 3-10 seconds of your explainer video statistics, you don’t want to see a huge immediate drop off.
The next thing I look at on the video’s analytics are the first three to ten seconds of the video. After people click play, are they sticking around to watch the rest of your video? Or is there a sharp drop off? Some amount of drop off is to be expected. However, if you notice a sharp drop off, consider changing the introduction of your video so that it’s more clear so that it hooks the viewer. You want to ensure they understand they will receive some value relevant to them if they keep watching the video.
Getting in touch with your video producer to whip up a new intro for your video is probably going to be expensive after you’ve already wrapped up production – so it makes sense to film a few alternate intros to your video when it’s being produced.
Checking For Abnormal Patterns
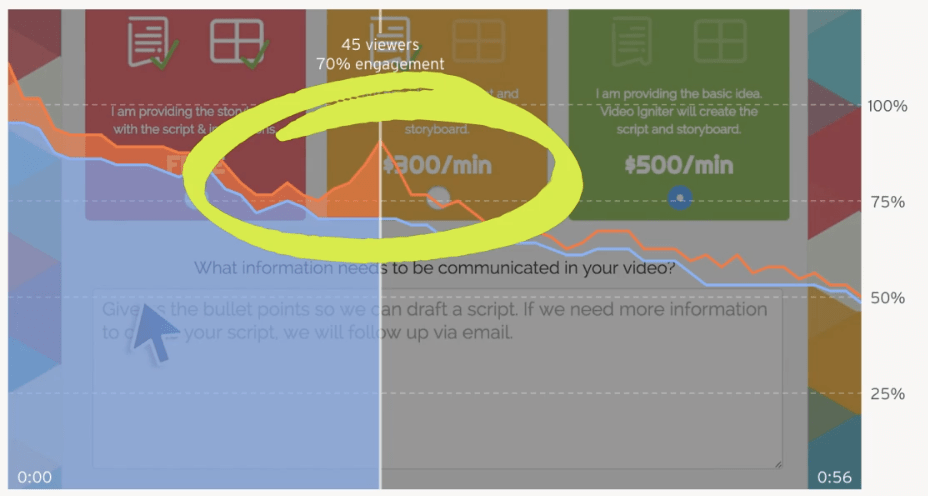
After the intro, I like to scan through the video to see if there are any abnormal patterns. Sharp drop offs usually mean the message is irrelevant to the viewer or the idea is presented at the wrong time. For example, it doesn’t always make sense to bring up your pricing in your main marketing video when you’re still in the early phases of educating your viewer.
Another pattern to look out for are places where people are going back and rewatching your video.

Review your explainer video analytics to see if there are sections where people go back to rewatch parts of your video.
Either that section is very compelling and worth revisiting… Or it’s unclear to your viewers what’s happening in that part. Which is why they have to go back and rewatch it again. Either way, you’ll need to do a little creative interpreting to determine if that section is effective… Or if you should change it… Or if you should remove it entirely from the video.
Does Your Video Have A Strong Ending?
The last thing I look at when analyzing a video’s viewing pattern is to see what people are doing at the end of the video. Hopefully most people are making it all the way to the end of your video. And if they do, are they taking action? And can you actually measure and track this action? Wistia, for example shows these little dots when someone clicks on the last scene of my video to take them towards the next action step… Like signing up or downloading an app. This is great and we want to optimize more of this kind of action in our marketing funnel.
That’s all for this episode, thank you for watching. If you want to support the show, share it with someone who will find this useful. Also, don’t forget to subscribe on YouTube for more video marketing tips.
What is Video Igniter Animation?
Check out our animated video portfolio to see our latest and greatest creations.
Animated Video Demo Reel


