
Understanding Your Explainer Video Statistics
Table of Contents
If you have a question about interpreting explainer video statistics that isn’t answered in this article, you can use our contact form to ask your question or click the image below to with a member of our production team:

Explainer Video Statistics Video Transcript
This is The Video Igniter Show where we teach you how you can use videos to improve your business. In this episode, you will learn how to look your explainer video statistics to see if people are engaged or if they click away too soon.
Why Your Explainer Video Statistics Matter
In this episode of The Video Igniter Show I’m going to teach you how to view your animated explainer video statistics. Knowing how to interpret & analyze that data will enable you to then improve the effectiveness and conversion rate of your videos.

Free Stats And Analytics For Your Animated Explainer Video
There are many different services out there you can use to host your videos that provide stats and analytics. This enables you to see how people are consuming your online videos. We’ve been using Wistia for over a decade. You can j using them for hosting and analytics because they have a free hosting plan available.

Services like Google Analytics and Wistia let you see your animated video analytics for free.
Understanding The Introduction Of Your Video
Here’s a video we already published that’s been online for a while now. It’s been seen by hundreds of people already which so there is enough data to show an average viewing pattern for the video. The first thing I look at is the play rate. That’s the percentage of people who arrive on my landing page and actually click play on the video. If your number is low, consider creating a different thumbnail that will encourage more people to click play on the video.
For B2B videos, it makes sense to use the thumbnail to explain what value and benefit the viewer will get if they take the time to watch your video.
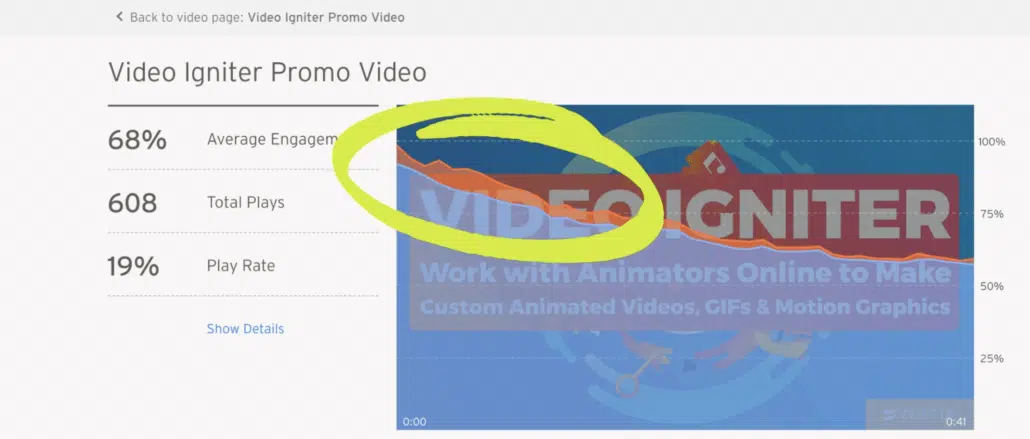
In the first 3-10 seconds of your explainer video statistics, you don’t want to see a huge immediate drop off.
The next thing I look at on the video’s analytics are the first three to ten seconds of the video. After people click play, are they sticking around to watch the rest of your video? Or is there a sharp drop off? Some amount of drop off is to be expected. However, if you notice a sharp drop off, consider changing the introduction of your video so that it’s more clear so that it hooks the viewer. You want to ensure they understand they will receive some value relevant to them if they keep watching the video.
Getting in touch with your video producer to whip up a new intro for your video is probably going to be expensive after you’ve already wrapped up production – so it makes sense to film a few alternate intros to your video when it’s being produced.
Checking For Abnormal Patterns
After the intro, I like to scan through the video to see if there are any abnormal patterns. Sharp drop offs usually mean the message is irrelevant to the viewer or the idea is presented at the wrong time. For example, it doesn’t always make sense to bring up your pricing in your main marketing video when you’re still in the early phases of educating your viewer.
Another pattern to look out for are places where people are going back and rewatching your video.
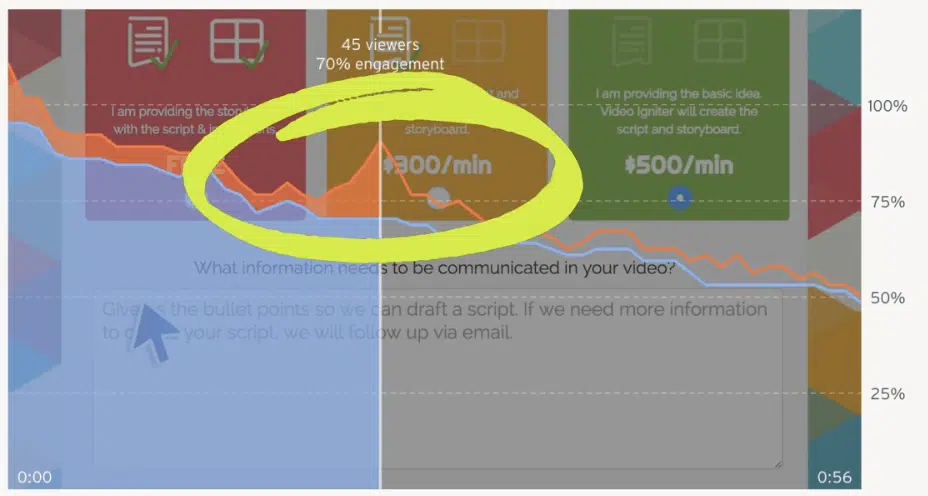
Review your explainer video analytics to see if there are sections where people go back to rewatch parts of your video.
Either that section is very compelling and worth revisiting… Or it’s unclear to your viewers what’s happening in that part. Which is why they have to go back and rewatch it again. Either way, you’ll need to do a little creative interpreting to determine if that section is effective… Or if you should change it… Or if you should remove it entirely from the video.
Does Your Video Have A Strong Ending?
The last thing I look at when analyzing a video’s viewing pattern is to see what people are doing at the end of the video. Hopefully most people are making it all the way to the end of your video. And if they do, are they taking action? And can you actually measure and track this action? Wistia, for example shows these little dots when someone clicks on the last scene of my video to take them towards the next action step… Like signing up or downloading an app. This is great and we want to optimize more of this kind of action in our marketing funnel.
That’s all for this episode, thank you for watching. If you want to support the show, share it with someone who will find this useful. Also, don’t forget to subscribe on YouTube for more video marketing tips.
Key Metrics to Track for Explainer Video Success
When it comes to tracking the success of your explainer video, focusing on specific metrics is crucial for gauging viewer engagement and improving your content over time. Here are the key performance indicators (KPIs) to monitor:
1. Play Rate: A Vital Starting Point

The play rate measures how many visitors clicked on your video after landing on your page. A low play rate suggests that your thumbnail, title, or video description may not be compelling enough. Consider testing different thumbnails or copywriting strategies to attract more clicks.
2. Engagement Rate: Are Viewers Watching the Full Video?
Engagement rate refers to the percentage of viewers who stay throughout the video. Pay close attention to where viewers drop off and tweak your content to retain their interest. High engagement signals that your explainer video is successfully communicating its message.
3. Drop-Off Points: Understanding Where You Lose Viewers

Tracking drop-off points is essential for understanding which sections of your video lose the most viewers. If the audience is dropping off significantly after the intro, you may need to revise your opening to hook viewers right away. On the other hand, a drop-off at the middle could indicate that the video is too long or loses focus.
4. Rewatch Rate: What Do Viewers Find Interesting?
A higher rewatch rate can signify that a particular section of your video is engaging or complex, prompting viewers to watch it again. Use this data to identify your video’s strongest points and areas that may need clarification or additional emphasis.
How Video Analytics Can Drive Your Marketing Strategy

By analyzing your explainer video statistics, you can identify trends and patterns that allow you to optimize your video for higher conversion rates. For example, understanding where your audience drops off helps refine the content, pacing, or call to action. Implementing these insights ensures your explainer video not only attracts viewers but also motivates them to take action, whether that’s signing up for a newsletter or purchasing a product.
Improve Conversion Rates with Data-Driven Insights

The ultimate goal of any explainer video is to convert viewers into customers. Tracking the conversion rate – the percentage of viewers who complete your desired action after watching the video – is crucial. This could mean downloading an ebook, subscribing to a service, or making a purchase.
By testing different calls to action at the end of your video and tweaking messaging throughout, you can increase the likelihood of achieving a higher conversion rate. For instance, including a limited-time offer or a strong call to action like “Click to Learn More” or “Get Started Now” may encourage more viewers to take immediate action.
Deeper Dive into Advanced Explainer Video Metrics

While play rate, engagement rate, and drop-off points are foundational, experienced marketers should track more nuanced metrics to gain a competitive edge. These advanced statistics provide a clearer picture of viewer intent and content performance.
Conversion Rate by Source Traffic

It’s not enough to know how many people converted after watching your video; you need to know where those viewers came from. Did the viewer arrive from a Google search, a social media ad, or an email campaign?
- Actionable Insight: If viewers coming from Facebook convert at 5% but those from your email newsletter convert at 15%, it suggests the messaging or audience targeting on Facebook may be misaligned with the video’s content or call-to-action (CTA). You can then optimize your ad copy or email segmentation accordingly.
- Measurement Tip: Most advanced video hosting platforms (like Wistia or Vidyard) integrate with Google Analytics to allow you to segment your conversion data based on the visitor’s original source or UTM parameters.
Attention Span by Device and Browser

Viewer behavior changes dramatically depending on how they access your content. A viewer on a desktop computer may be more focused than one on a mobile device during their commute.
- Actionable Insight: If you see significantly lower engagement rates on mobile devices, consider producing a shorter, more concise cut of your explainer video specifically for mobile viewing. You might also need to ensure your video player and CTA are flawlessly optimized for smaller screens. A mobile-first approach to content length and pacing is often required for high-ranking content.
- Measurement Tip: Check your analytics dashboard for filters that show data segmented by device (Desktop, Mobile, Tablet) and browser type.
Heatmaps and Click Data Integration

For explainer videos embedded on a landing page, the video player itself is only one part of the viewer experience. Using website heatmapping tools alongside your video analytics can be extremely revealing.
- Actionable Insight: A heatmap might show that viewers scroll past the video player to read a testimonial before scrolling back up to hit play. This suggests that the testimonial is a strong pre-conversion element you should consider highlighting in your video’s introduction. Similarly, you can see if viewers click on your CTA link immediately after the video ends or if they navigate elsewhere on the page first.
- Measurement Tip: Tools like Hotjar or Crazy Egg can be set up to track user interaction on pages where your video is embedded, providing a visual overlay of scrolling and clicking behavior.
Platform-Specific Analytics: Optimizing for Your Host

The metrics you track and how you act on them often depend on where your video is hosted. While internal hosting (like Wistia or Vidyard) offers granular data for conversion tracking, external platforms (like YouTube) focus on reach and organic discovery.
Maximizing Data on Internal Hosting Platforms (Wistia, Vidyard, etc.)

These platforms are essential for B2B marketers because they integrate deeply with marketing automation and CRM tools.
- Gating and Lead Generation: Track the percentage of viewers who submit their information at a specific point in the video (e.g., after 30 seconds). This allows you to generate qualified leads directly from your content. Use data to determine the optimal “gating” point—too early and you lose viewers, too late and you miss leads.
- Engagement Scoring: Use the data to assign a lead score based on the percentage of the video watched. A lead who watched 75% of your technical explainer video is arguably more qualified than one who watched 20% of a general overview. This informs your sales team’s follow-up prioritization.
Leveraging YouTube Analytics for Reach and SEO

If your explainer video is hosted on YouTube, the focus shifts toward organic visibility and audience growth.
- Click-Through Rate (CTR) from Impressions: This metric measures how often users click your video after seeing your thumbnail and title on YouTube (in search results, suggestions, etc.). A low CTR is a direct sign that you need to A/B test a new, more compelling thumbnail and title combination to improve your video’s ranking.
- Audience Retention Curve: Similar to engagement rate, but YouTube’s specific graph is highly sensitive. Pay close attention to the first 30 seconds—a steep initial drop-off here is common and devastating to YouTube’s algorithm, as it signals poor content quality.
A/B Testing Your Explainer Video Using Data

The core value of analytics is not just seeing what happened, but using that information to drive change. Data-driven A/B testing is how you refine your explainer video into a high-conversion asset.
Step 1: Isolate the Variable
Based on your drop-off points, isolate the single weakest part of your video.
- High Initial Drop-Off? The variable is the Introduction/Hook. Create an alternate 10-second opening scene.
- Sharp Mid-Video Drop-Off? The variable is the Pacing/Complexity of a specific section. Re-edit or simplify the visuals and script for that 20-second segment.
- Low Conversion Rate? The variable is the Call-to-Action (CTA). Test a different CTA button color, phrasing (“Get Started Now” vs. “Learn More”), or placement (mid-video vs. end-of-video).
Step 2: Implement the Test
Using your video hosting platform’s A/B testing features, serve the original version (Control) to 50% of viewers and the new version (Variant) to the other 50%.
Step 3: Analyze and Deploy
Track the key metric most relevant to your test (e.g., Engagement Rate for a new hook, or Conversion Rate for a new CTA). Once you have statistically significant data (which may take weeks or months depending on traffic), deploy the winning variant permanently. Continuous, data-informed iteration is key to maximizing the return on your explainer video investment.
Want Help To Improve Your Video Conversion Rates?

Video Igniter’s video promotion team can help you develop and refine your explainer video to improve its conversion rate over time. Send us a message or schedule a call to speak with our team about improving your video’s effectivness.
What is Video Igniter Animation?
Check out our animated video portfolio to see our latest and greatest creations.

Animated Video Demo Reel
Explainer Video Statistics Resources

Looking for extra help create an explainer video or get the most out of your existing video? Check out these free resources:
6 Ways To Get High Viewer Engagement For Your Animated Videos
Add Animated Infographic Video Content To Increase Engagement
How To Create A Homepage Video That Generates Leads For Your Company
What Explainer Video Services Does Video Igniter Offer?

