
Frequently Asked Questions About Making An Animated Infographic Video
Table of Contents
Animated infographic videos are a great way to explain new information and help people visualize data and information. Animated video infographics can help bring data to life and make it easier for us to understand and compare different things. They’re also incredibly fascinating to watch. Your video engagement rates will go through the roof if you’re used to only making ‘talking head’ videos. We get a lot of questions about making animated infographic videos and wanted to create a resource with answers to all those questions.
If you have a question about animated infographics that isn’t answered in this article, you can use our contact form to ask your question or click the image below to with a member of our production team:

Examples of Animated Infographic Videos You Can Get From Video Igniter
Video Igniter can create any kind of 2D or 3D animated video for you. Check out the example videos below.
To start your project contact us, schedule a call with our production team or request access to our new pricing page.

Are you looking for an example of a different style of animation? Send us a message to let us know what kind of animation example you want to see and we will follow up with relevant production samples.
Why do people make animated infographics?
Animated infographics help keep people’s attention when explaining new data and information. By using a custom animated visuals to enhance what the narrator is explaining, the viewer has more context to be able to understand the data that is being presented to them. Sometimes, animation is the only way to visually articulate what needs to be explained. The added benefit of using animation is that people love watching animations. It helps keep the viewer’s attention focused while they learn. It improves their ability to comprehend what is being explained. And most importantly – it increases their ability to retain the information.

How to make animated infographic video:
Research research research.
The first step to create an animated info video is to identify which facts and statistics you want to present in the video. In many cases, Internet research is sufficient for identifying facts. Just make sure you have credible sources for everything. More advanced videos may require industry experts, scientists and statisticians to help make sense of the data you want to present.
However you plan to generate content for your animated video, make sure you can verify the sources. Keep track of your sources so that you can include them within your video or in the description section for your video.
Research And Write The Script
Now it’s time to tie the facts together into an interesting narrative. Look at all the information you want to present and identify how you want to organize the information so that viewers will have enough context to understand each new piece of information.

Sometimes, animated infographics videos don’t include the use of a voiceover and rely entirely on data visualization and text on screen to present the story. If you plan on using a voiceover, write out the voiceover script for your animated infographic video. If you don’t plan on using a voiceover, write detailed descriptions of what you want to present on screen and how you want to show it. The more detailed you can be, the better.
Create Your Storyboard
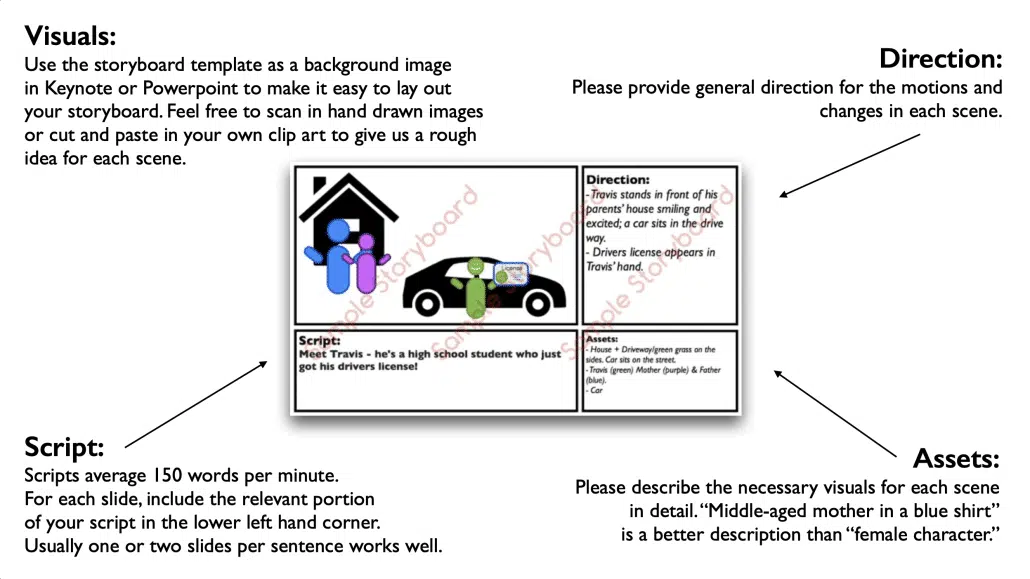
After you’ve organized the presentation of information, it’s time to get specific and create instructions for the illustrators and animators so they know what to create. The diagram below shows what information is included on each slide of a storyboard. Note that for an animated infographic video, it’s possible you may not have a voiceover to display on each slide.
Pick Out A Soundtrack
Soundtracks are a great way to bring more energy and excitement to your animated video infographic. You may want to consider sourcing the soundtrack early in the production process. If you find a soundtrack with fun beats and interesting moments, you can design your storyboard around the soundtrack so that certain animations happen in sync with specific parts of the song. You can find great soundtracks at reasonable rates on AudioJungle and PremiumBeat.

When you or your animation team look for soundtracks, make sure to select a soundtrack that is appropriate for the vibe of the data story you are presenting in the video. If your video is about climate change, choose something serious or inspirational. Or if your video has more of a focus on tech, choose a soundtrack with a corporate or electronic vibe.
Check out this video if you want to learn how to select the perfect soundtrack for your animated video!
Record The VoiceOver
If your animated infographic video includes a voiceover, we recommend auditioning 3-5 voiceover artists. Look for voiceover talent on sites like Fiverr, VoiceBunny or Voices123. Hire your top candidates to record the first 1-3 sentences of your voiceover. Then pick your favorite artist to record the full voiceover.

We recommend adding notes to your script to help your voiceover artist understand how to record the script. This can include notes about the tone/energy to use, how to pronounce difficult words, what inflection to use, when to speed up or slow down, and more.
Create Illustrations For Your Infographic Video
Since you’re making an animated infographic video, you’ll want to find an illustrator or animation studio that has experience with information design and data visualization. Not all illustrators are automatically great data visualizers. Make sure you find someone that has previous experience creating animated visuals that present information in an attractive manner without diluting or introducing bias into the presentation of the data via poor design choices.

After the storyboard is approved, your illustration team will review your brand guidelines and the style references you provide. The illustration team will take one scene from your storyboard and use it to create one or more pieces of concept art.
After you review the concept art, let your illustration team know which design aspects you like and which ones you don’t like. They will use your feedback to revise the art and create a new style frame for the video. You can revise it again if needed. When you are completely happy with the style frame, the illustrator(s) will create the rest of the art for your animated infographic using the style frame as a reference.
You will get a chance to review all the art and request revisions before approving it for production.
Animate Your Infographic Video

Finally – the research is done, the voiceover is approved and the art is locked in. Time to make the magic happen. Your animators will take about one week to animate each minute of animation. Projects longer than 2 minutes will likely use more than one video animator in order to increase the number of minutes of animation that can be animated each week. When you get the first draft of your animated infographic, give it a detailed review. Internally and externally. Have your in house team review it to make sure it stays true to your brand’s guidelines. It’s also important to share it with members of your target audience to ensure they understand what is being communicated in each of the visuals.
Provide feedback to your animation team using a format similar to this:
0:01-0:05: Speed up the appearance of the logo so it can be on screen longer.
1:32: Remove the green outline.
0:25, 0:47, & 2:12: Some sort of unintended glitch effect appears when the graph animates into view? Please investigate.
Sound Effects
Finally, after your animated infographic is approved, a sound effects specialist will go through to add sound effects to make the motion graphics pop even more.
How to choose a producer to make your animated infographic video?

Looking for an animated infographics video producer but not sure where to start? There are many factors to consider when shopping around for an animation studio, a freelance animator, or a production service like Video Igniter Animation including: pricing, visual style, storytelling, customer service, production timelines and more. Here are some resources to help you figure out the right production option for your animated infographic video:
– 9 Things to Look For When Hiring An Animator
– Pros and Cons of Different Animation Styles
– What’s the difference between hiring a freelance animator vs an animation studio vs Video Igniter?
– Considering making the video yourself? Learn about DIY options.
– What is Video Igniter Animation?
What does it cost to make an animated infographics video?

The animation, design, voiceover and music components of an animated infographic video typically cost $1,000-$4,500 for each minute of 2D animation. The research and script writing/storyboard creation can vary in cost depending on how much research needs to be done. If the research hasn’t been done, consider handling that part of production in-house. If you already have facts and sources you can provide to your animation team, they can help develop the script and storyboard and craft the overall narrative flow of the information for your animated infographic.
How long does it take to make an animated video infographic?

Animated infographics take 2-6 weeks to create a 1-2 minute 2D animated infographic. Rush delivery is available if you need to guarantee delivery before a quickly approaching deadline. To learn more about the production workflow for an animated infographic video – including how long each stage of production takes – check out this companion article.
How long should an animated infographic be?

Animated infographics can be 30 seconds and they can also go over 5 minutes. Length isn’t as important when it comes to an animated infographic if you can keep the information relevant and interesting. If you’re making a documentary, it’s possible that you’ll be creating a variety of 3-30+ second clips to intersperse throughout the film.
Tips to keep your animated infographic budget low
Do your own research
If you don’t already have statistics prepared for your animated infographic video, you can do it yourself or you can hire someone to do it for you. For some videos, simple internet research is enough to find interesting facts with sources you can integrate into your infographic explainer video.
Create your script (and storyboard)

Organizing data into a logical story is a unique skillset. Your average copywriter may not possess the necessary experience to turn data into a compelling story for an animated infographic video. If you can’t find a writer and a storyboard artist that can help you think through what order to present the information and how to bring it to life with visuals, consider taking a stab at it yourself. You know your target audience best so you stand a good chance at being able to craft a good first draft of how you want to logically present the stats and information in your animated infographic.
Free Download: Get our storyboard template and creation guide.
Record the voiceover
Voiceover’s cost $10-$300 per 1-2 minutes of recorded audio for an animated infographic video in English. You can avoid this production cost by recording your own voiceover at home – without having to buy any professional equipment or software. Check out the 1:31 in Episode 3 of The Video Igniter Show to see how you can create your own professional sounding recording at home for free.
Use stock assets
![]()
If you don’t have a budget for an animated infographics video with fully custom illustrations, consider letting your illustration team create your video using some stock assets. Using pre-created icons, fonts, images, etc, can help reduce your video’s production budget. Affordable stylish icons are available at The Noun Project – you can use them for for free if you credit the creator.
Use free music
Free soundtracks are available to use in your animated infographic video as long as you credit the creator.
The Psychological Impact of Animated Infographic Videos on Viewer

Animated infographic videos are more than just visually appealing—they tap directly into the way our brains process and retain information. Unlike static visuals or plain text, animation introduces movement, color, sound, and storytelling, which can dramatically improve how an audience understands and remembers complex information.
At a neurological level, our brains are wired to pay attention to motion. Animated infographic videos harness this cognitive reflex to guide the viewer’s focus toward key data points and important insights. By combining motion graphics with carefully curated voiceovers and music, these videos activate multiple areas of the brain simultaneously, increasing attention and engagement.
Emotion also plays a crucial role. A well-crafted animated infographic video can evoke feelings of curiosity, excitement, or urgency—emotions that drive deeper connection with content. For example, videos that illustrate environmental or social issues using animation tend to generate stronger empathy and higher engagement than static reports.
By visualizing data dynamically, animated infographic videos help audiences better recall statistics, trends, and messages long after the video ends.
Common Mistakes to Avoid When Creating an Animated Infographic Video

While animated infographic videos are highly effective tools for communication, many businesses make critical mistakes that limit their impact. One of the most common errors is overloading the video with too much information. Just because animation offers creative freedom doesn’t mean you should cram every fact or figure into one video. Keep it focused, simple, and purposeful.
Another frequent mistake is failing to establish a strong narrative structure. A successful animated infographic video isn’t just a slideshow of stats—it’s a story with a clear beginning, middle, and end. Without that flow, viewers may lose interest or miss the point entirely.
Brand inconsistency is another pitfall. When your visuals, tone, or messaging don’t align with your company’s brand, the video can feel disjointed and unprofessional. Your animated infographic video should reinforce your brand’s identity in every frame—through colors, fonts, voiceover style, and pacing.
Technical details matter too. Poor-quality audio or voiceovers can ruin the viewer experience, no matter how good the visuals are. Likewise, neglecting to include a clear call-to-action (CTA) means viewers may walk away without knowing what to do next.
Other common issues include overcomplicating the design, not optimizing for mobile viewing, rushing the animation pacing, and ignoring accessibility best practices. If your animated infographic video lacks subtitles, for example, it becomes less effective for mobile viewers and those with hearing impairments.
Avoiding these mistakes ensures your animated infographic video delivers maximum value—whether you’re educating, marketing, or driving conversions.
How to Use Animated Infographic Videos in Your Social Media Strategy
Social media platforms are saturated with content, making it increasingly difficult to stand out. That’s where animated infographic videos come in. Their eye-catching motion and data-driven storytelling are perfect for stopping thumbs and grabbing attention in a crowded feed.
To get the most out of your animated infographic video on social media, it’s essential to choose the right platform. Short, vertical videos perform well on TikTok, Instagram Reels, and Stories, while longer-form, horizontal formats are better suited for LinkedIn or YouTube. Tailor your video’s length and orientation to fit the habits of your audience on each platform.
Animated infographic videos also work best when paired with platform-specific call-to-actions (CTAs). For instance, a “Swipe Up” on Instagram or “Click the link” on LinkedIn can drive viewers to your landing page or blog post. Be sure to include subtitles, as many users watch videos with the sound off.
Hashtags and captions are also key to discoverability. Combine trending hashtags with descriptive keywords like #animatedinfographic or #visualdata to increase reach. And don’t forget to use your caption to set the stage—highlighting the data point or question your video answers.
Another tip is to repurpose your animated infographic video content. A single 60-second video can be sliced into bite-sized clips, GIFs, or carousels to create multiple posts across different platforms. This helps you maintain a consistent message while maximizing content value.
Finally, measure your success. Look at engagement metrics like views, shares, watch time, and clicks. These insights can guide future video production and help you fine-tune your content strategy over time. When used correctly, animated infographic videos can supercharge your social media presence and elevate your brand’s voice online.
How Animated Infographic Videos Improve Website Engagement Metrics

Using an animated infographic video on your website is a proven strategy for increasing user engagement and improving key performance indicators. These dynamic visuals not only make your content more engaging but also help deliver complex information in a more digestible and entertaining way. When visitors land on a page that features an animated infographic video, they’re far more likely to stick around.
One of the biggest benefits is reduced bounce rates. Users are more inclined to stay on a website that offers rich, interactive content. Animated infographic videos quickly communicate value and encourage visitors to continue exploring your site. They offer instant clarity, which is especially useful on landing pages or product detail pages where grabbing attention fast is crucial.
These videos also significantly increase average time on page. Instead of quickly skimming through paragraphs of text, users are more likely to watch an entire video, especially if it’s concise and visually compelling. This behavior signals to search engines that your site provides valuable content—boosting your SEO and helping your page rank higher.
Conversions also tend to improve when animated infographic videos are used strategically. Whether it’s guiding users to sign up for a service, download a resource, or make a purchase, the right video can increase clarity and trust—two major factors in conversion rate optimization. When viewers see data visualized clearly, they’re more confident in taking the next step.
To maximize results, be sure to embed your animated infographic video above the fold or near your call-to-action. Monitor performance using tools like Google Analytics or heatmaps to track interactions and make data-informed adjustments. With the right implementation, these videos can become one of your website’s most powerful engagement tools.
How to Measure the ROI of Your Animated Infographic Video

Creating an animated infographic video is an investment—one that you should be able to justify with clear returns. Measuring the ROI of your video starts with defining its purpose. Are you trying to generate leads, increase sales, educate your audience, or build brand awareness? Your objective will dictate which performance metrics to track.
For marketing and sales goals, monitor conversions, cost-per-lead, and click-through rates from video-linked CTAs. Tools like Google Analytics, YouTube analytics, and video hosting platforms (like Wistia or Vimeo) can help you determine how well your animated infographic video is contributing to these goals. If you’re using it for education or internal training, completion rates and user feedback are key performance indicators.
It’s also important to consider attribution. Depending on your sales funnel, your animated infographic video might be one of several touchpoints. In these cases, use multi-touch or linear attribution models to calculate ROI more accurately. A single view might not lead to an immediate purchase, but it can play a vital role in building trust and pushing prospects further down the funnel.
Don’t forget to account for intangible benefits. Animated infographic videos can boost your credibility, reinforce your branding, and increase your visibility across search engines and social media. While harder to quantify, these factors play a major role in your long-term growth.
To calculate ROI, subtract your production and distribution costs from the total value generated (revenue, leads, or other conversions attributed to the video), then divide by the initial cost. This will give you a clear picture of whether your animated infographic video is paying off—and how you can make the next one even more effective.
The Science Behind Data Visualization in Animated Infographic Videos

At the core of every effective animated infographic video is data visualization—a discipline rooted in both art and science. The way you present data can make or break how well your audience understands and engages with it. Animated infographic videos harness the power of motion, color, and hierarchy to transform raw numbers into memorable narratives.
Our brains are naturally wired to recognize patterns, and animated visuals help guide that recognition. Unlike static charts or spreadsheets, an animated infographic video uses movement to highlight important shifts, trends, or comparisons. By layering animation over data, you create a guided experience that makes information easier to digest and remember.
Color theory also plays a huge role. Strategic use of contrasting colors helps draw the eye to key figures, while consistent color-coding can group related data points. Similarly, visual hierarchy—established through size, position, and motion—ensures that the most important data stands out clearly.
Choosing the right type of chart or graphic is critical. Bar graphs, pie charts, timelines, and animated maps are especially effective in motion-based storytelling. The goal is to communicate the data quickly and accurately without overwhelming the viewer. Animation can show changes over time, emphasize specific data points, and break down large data sets into smaller, sequential scenes for better comprehension.
It’s important, however, to maintain integrity. Over-stylizing your animated infographic video can lead to misinterpretation if visual metaphors distort the meaning of the data. Clarity should always come first. A well-designed animated infographic video finds the balance between creativity and precision, making complex ideas accessible to everyone.
When done right, data visualization in animated videos doesn’t just inform—it inspires. It empowers viewers to grasp new insights, connect with your message, and take action based on what they’ve learned.
Still Have Questions About Animated Infographic Videos?

Do you have a question about animated infographic videos that wasn’t answered in this FAQ? Use this contact form to contact us with your question. We’ll follow up with a response and add the Q+A to this FAQ.
People looking for answers about animated infographic videos may also find the answer to their question in this article about how to create an animated explainer video.
Hire Video Igniter to Create Your Animated Infographic Video
Video Igniter is an animation studio for hire that provides world class design and animation services at prices startups can afford.
We can make any kind of 2D or 3D animated infographic video you can imagine.
+20 reasons companies love hiring us to create animated infographic videos.
Demo Reel:
Success Stories & Testimonials
“Video Igniter came to us with a number of creative and engaging ideas and were able to create an exciting, impactful video in a short period of time. And the best part was that it cost much less than other options of similar quality. The video they made is a great marketing tool for us.”
Alex Raymond – Founder, Kapta Systems
“I run a video production company and outsource animation. The team at Video Igniter did a great job in taking the concept I very crudely drew out and made it into a beautiful animation. The review process was easy and their turnaround time was very quick. I’d def recommend them if you’re looking for an animation project.”
Pat Henderson – Founder, Path8 Productions
“My whole family and everyone on Facebook thinks you are amazing. My whole office is freaking out.”
Patricia Shields – Real Estate Agent
“Video Igniter offered us the critical combination of creative value, clear communication, and patience with stakeholder feedback. We ended up with truly high-quality design assets for our video series largely due to the extra level of commitment — and the right balance of efficiencies with flexibility in the process when called for.”
Larry Schlessinger – Sr. Creative Program Manager, Amazon Web Services
“I am beyond satisfied with my experience with Video Igniter. The first drafts of the work were almost exactly what I had in my head when developing the concept. After that each step along the way was seamless until arriving at a perfect finished product. And all this at a tremendous value. Anyone who has considered creating a marketing video should check out Video Igniter.”
Anonymous Customer Feedback

Get in touch about your animated infographic video
Schedule a call to discuss your custom animated video project with our production team.
Get a quote for your animated infographic.
Check out our animated video portfolio.
Request access to our newest price sheet.
Create your Video Igniter account, fill out a creative brief, and we’ll start creating your animated infographic.

